Principles and Applications
I. Operational Principles of SECM
As in other types of scanning probe microscopy, SECM is based on the movement of a very small electrode (the tip) near the surface of a conducting or insulating substrate.1 In amperometric SECM experiments, the tip is usually a conventional ultra-microelectrode (UME) fabricated as a conductive disk of metal or carbon in an insulating sheath of glass or polymer. Potentiometric SECM experiments with ion-selective tips are also possible.2
In amperometric experiments, the tip current is perturbed by the presence of the substrate. When the tip is far (i.e. greater than several tip diameters) from the substrate, as shown in Fig. 1A, the steady-state current, iT,∞ , is given by
iT,∞ = 4nFDCa
where F is Faraday's constant, n is the number of electrons transferred in the tip reaction (O + ne → R), D is the diffusion coefficient of species O, C is the concentration, and a is the tip radius. When the tip is moved toward the surface of an insulating substrate, the tip current iT decreases because the insulating sheath of the tip blocks diffusion of O to the tip from the bulk solution. The closer the tip gets to the substrate, the smaller iT becomes (Fig 1b). On the other hand, with a conductive substrate, species R can be oxidized back to O. This produces an additional flux of O to the tip and hence an increase in iT (Fig. 1c). In this case, the smaller the value of D, the larger iT will be, with iT → ∞ as D → 0, assuming the oxidation of R on the substrate is diffusion-limited. These simple principles form the basis for the feedback mode of SECM operation.
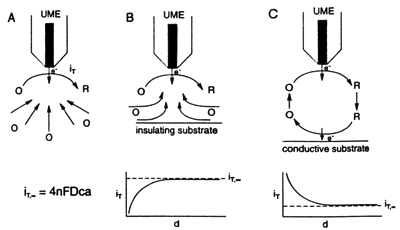
When the tip is rastered in the x-y plane above the substrate, the tip current variation represents changes in topography or conductivity (or reactivity). One can separate topographic effects from conductivity effects by noting that over an insulator iT is always less than iT,∞, while over a conductor iT is always greater than iT,∞.
In the feedback mode of the SECM operation mentioned above, the overall redox process is essentially confined to the thin layer between the tip and the substrate. In the substrate-generation/tip-collection (SG/TC) mode (when the substrate is a generator and the tip is a collector), the tip travels within a thin diffusion layer generated by the substrate electrode.1b,3 There are some shortcomings which limit the applicability of the SG/TC mode if the substrate is large: (1) the process at a large substrate is always non-steady state; (2) a large substrate current may cause significant iR-drop; and (3) the collection efficiency, i.e., the ratio of the tip current to the substrate current, is low. The tip-generation/substrate-collection (TG/SC) mode is advisable for kinetic measurements, while SG/TC can be used for monitoring enzymatic reactions, corrosion, and other heterogeneous processes at the substrate surface.
Example Applications
- Electrode surface studies
- Corrosion
- Biological samples
- Solid dissolution
- Liquid/liquid interfaces
- Membranes
II. Applications
A. Imaging and positioningA three-dimensional SECM image is obtained by scanning the tip in the x-y plane and monitoring the tip current, iT, as a function of tip location.
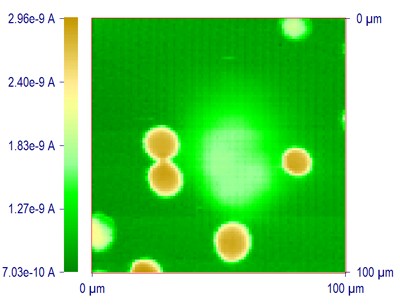
A particular advantage of SECM in imaging applications, compared to other types of scanning probe microscopy, is that the response observed can be interpreted based on fairly rigorous theory, and hence the measured current can be employed to estimate the tip-substrate distance. Moreover, SECM can be used to image the surfaces of different types of substrates, both conductors and insulators, immersed in solutions. The resolution attainable with SECM depends upon the tip radius. For example, Fig. 2 shows one SECM image of a filtration membrane obtained with a 2 μm diameter Pt disk tip in Fe(CN)64- solution. Average pore diameter is ca. 10 μm. An image demonstrating the local activity of an enzymatic reaction on a filtration membrane is shown in Fig. 9 as described below.
B. Studies of heterogeneous electron transfer reactions
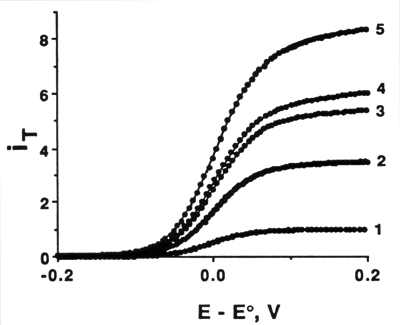
SECM has been employed in heterogeneous kinetic studies on various metal, carbon and semiconductor substrates.4 In this application, the x-y scanning feature of SECM is usually not used. In this mode, SECM has many features of UME and thin layer electrochemistry with a number of additional advantages. For example, the characteristic flux to an UME spaced a distance d from a conductive substrate is of the order of DC/d, independent of the tip radius a when d < a. Thus, very high fluxes and thus high currents can be obtained. For example, the measurement of the very fast kinetics of the oxidation of ferrocene at a Pt UME has been carried out.4e Five steady-state voltammograms obtained at different distances are shown in Fig. 3, along with theoretical curves calculated with the values of kinetic parameters extracted from quartile potentials. The heterogeneous rate constant ko obtained (3.7 ± 0.6 cm/sec) remains constant within the range of experimental error, while the mass-transfer rate increases with a decrease in d.
C. Studies of homogeneous chemical reactions
In the same manner as the rotating ring disk electrode (RRDE), the TG/SC mode of SECM described above (with small tip and substrate), is particularly well suited to the studies of homogeneous chemical kinetics.1b,5 The SECM approach has the additional advantage that different substrates can be examined easily, i.e., without the need to construct RRDEs that can be rather difficult to fabricate, and higher interelectrode fluxes are available without the need to rotate the electrode or otherwise cause convection in the solution. Moreover, in the TG/SC mode, the collection efficiency in the absence of perturbing homogeneous chemical reactions is near 100%, compared to significantly lower values in practical RRDEs. Finally, although transient SECM measurements are possible, most reported applications have involved steady-state currents, which are easier to measure, are not perturbed by factors like double-layer charging, and also allow for signal averaging. For example, the reductive coupling of both dimethyl-fumarate (DF) and fumaronitrile (FN) in N,N-dimethyl formamide has been studied with the TG/SC mode.5a Fig. 4 shows tip and substrate steady-state voltammograms in the TG/SC regime. Comparable values of both of the plateau currents indicate that the mass transfer rate was sufficiently fast to study the rapid homogeneous reaction. From the approach curves of tip and substrate currents obtained at various FN concentrations (Fig. 5), a rate constant kc = 2.0 (± 0.4) x 105 M-1s-1 was determined for the dimerization reactions.
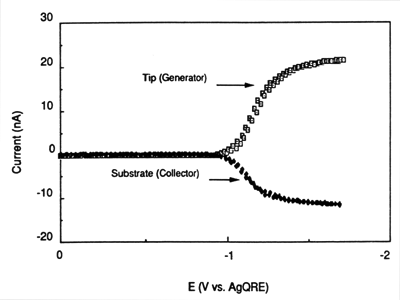 Figure 4. SECM voltammograms for FN (28.2 mM) reduction in TG/SC mode, with d = 1.8 μm. ET was scanned at 100 mV/sec with ES = 0.0 V vs AgQRE. (Reprinted with permission from Ref. 5a, copyright 1992, American Chemical Society.)
  Figure 5. (a) Normalized tip (generation) and (b) substrate (collection) current-distance behavior for FN reduction. FN concentration: (open circles) 1.50 mM, (open squares) 4.12 mM, (open triangles) 28.2 mM, and (filled circles) 121 mM. The tip radius a = 5 μm and the substrate radius is 50 μm. The solid lines represent the best theoretical fit for each set of data. (Reprinted with permission from Ref. 5a, copyright 1992, American Chemical Society.)
 D. Characterization of thin films and membranes
SECM is also a useful technique for studying thin films on interfaces. Both mediated and direct electrochemical measurements on thin films or membranes can be carried out. For example, polyelectrolytes, electronically conductive polymers, passivation films on metals, and dissolution processes have been investigated by SECM.6 A unique type of cyclic voltammetry, called tip-substrate cyclic voltammetry (T/S CV), has been used to investigate the electrochemical behavior of an Os(bpy)32+-incorporated Nafion film.6a T/S CV involves monitoring the tip current vs. the substrate potential (ES) while the tip potential (ET) is maintained at a given value and the tip is held near the substrate. The substrate CV (iS vs. ES) of an Os(bpy)32+-incorporated Nafion film covering a Pt disk electrode in Fe(CN)63- solution only shows a wave for the Os(bpy)32+/3+ couple (Fig. 6B), indicating the permselectivity of the Nafion coating. Fig. 6A shows the corresponding T/S CV curves. When the tip is far from the substrate, iT is essentially independent of ES. When the tip is close to the substrate (d = 10 μm), either negative or positive feedback effects are observed, depending on the oxidation state of the Os(bpy)32+/3+ couple in the Nafion. When ES is swept positive of the Os(bpy)32+/3+ redox wave, a positive feedback effect is observed due to the regeneration of Fe(CN)63- in the solution gap region because of the oxidation of Fe(CN)64- by Os(bpy)33+ at the solution-film interface. When ES is negative of the redox wave, the film shows negative feedback behavior, since the Os(bpy)32+ formed is unable to oxidize tip-generated Fe(CN)64- back to Fe(CN)63-.

E. Liquid-liquid interfaces
One of the most promising applications of SECM is the study of charge transport at the interface between two immiscible electrolyte solution (ITIES).7 Unlike conventional techniques, SECM allows for the studies of both ion and electron transfer at the interface. For example, uphill electron transfer, in which an electron is transferred uphill from a redox couple with a higher standard reduction potential in one phase to another redox couple having a lower standard reduction potential in a second immiscible phase has been demonstrated using the system TCNQ (in 1,2-dichroloethane [DCE])/ferrocyanide (in water).7c Fig. 7 shows the approach curve obtained as the UME approaches the interface when the system contains supporting electrolytes with no partitioning ions such as tetraphenylarsonium (TPAs+). However, the reverse electron flow for the same redox reaction can be induced by employing TPA+ as a potential-determining ion as shown in Fig. 8. The driving force for this reverse electron transfer is the imposition of an interfacial potential difference by the presence in solution of TPA+ in both phases (Δowφ = -364 mV). Note that the detection of reverse electron flow in this case could not be done using methods commonly used for studies of the ITIES, e.g., cyclic voltammetry. Since the ITIES is not polarizable in the presence of TPA+ in both phases, any attempt to impose externally a potential across the interface with electrodes in two phases would result in interfacial ion transfer and a current flow. The SECM approach does not suffer from this interference. Charge transfer processes across the ITIES with or without membranes have also been studied.
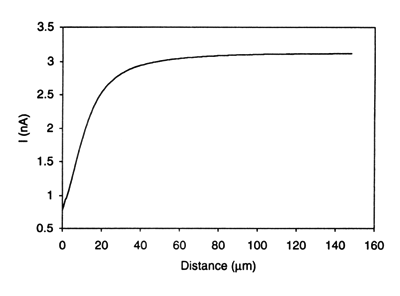 Figure 7. Approach curve for the system: 10 mM TCNQ and 1 mM TPAsTPB in DCE // 1 mM Fe(CN)63- and 0.1 M LiCl in H2O, showing the absence of electron transfer across the liquid/liquid interface. A 25 μm diameter Pt microelectrode was used to generate Fe(CN)64- at the electrode tip from the Fe(CN)63-. Tip potential, -0.4 V vs Ag/AgCl. (Reprinted with permission from Ref. 7c, copyright 1995, American Chemical Society.)
 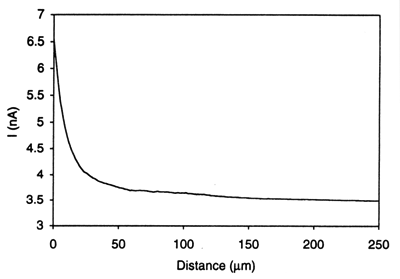 Figure 8. Approach curve for the system: 10 mM TCNQ and 1 mM TPAsTPB in DCE // 1 mM Fe(CN)63-, 0.1 M LiCl and 1 mM TPAsCl in H2O, showing reverse electron transfer driven by the phase transfer catalyst TPAs+. Tip potential, -0.4 V vs Ag/AgCl. (Reprinted with permission from Ref. 7c, copyright 1995, American Chemical Society.)
 F. Probing patterned biological systems
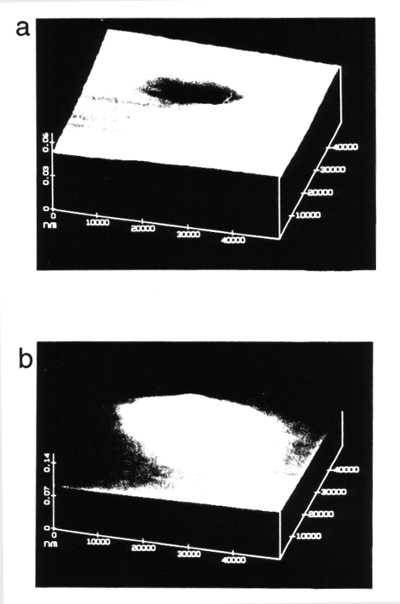
SECM has been actively employed to probe artificially or naturally patterned biological systems.8 Both amperometric and potentiometric techniques with ion-selective tips can be used. A direct test of the SECM's ability to image an enzymatic reaction over a localized surface region8a is shown in Fig. 9. Glucose oxidase (GO) hydrogel was filled inside small, well-defined pores of a polycarbonate filtration membrane. The buffered assay solution contained a high concentration of D-glucose as well as two redox mediators, methyl viologen dication (MV2+) and neutral hydroquinone (H2Q). Fig. 9a shows an image obtained with a tip potential of -0.95 V vs. a silver quasi reference electrode (AgQRE) where MV2+ was reduced to MV+.. Since MV+. does not react with reduced GO at the hydrogel-filled region, a negative feedback current was obtained. However, with the tip potential changed to 0.82 V, where hydroquinone was oxidized to p-benzoquinone by reduced GO, an increased tip current was observed (Fig. 9b). This positive feedback current over the hydrogel region indicates a significant catalytic feedback of the hydroquinone and provides a direct image of the local enzymatic reaction.
G. Fabrication
The SECM can be used to fabricate microstructures on surfaces by deposition of metal or other solids or by etching of the substrate.9 Two different approaches have been used, direct mode9a,b and feedback mode9c. Typically, in the direct mode, the tip, held in close proximity to the substrate, acts as a working electrode (in deposition reactions) or as the counterelectrode (in etching processes). The feedback mode of fabrication utilizes the same arrangement as in SECM imaging.
The tip reaction is selected to generate a species that reacts at the substrate to promote the desired reaction, i.e., deposition or etching. For example, a strong oxidant, like Br2, generated at the tip can etch the area of the substrate, e.g., GaAs, directly beneath the tip.9d The mediator reactant is chosen to be one that reacts completely and rapidly at the substrate, thus confining the reaction to a small area on the substrate and producing features of area near that of the tip. Small tip size and close tip-substrate spacing are required for high resolution.
III. References
- (a). A. J. Bard, F.-R. F. Fan, J. Kwak, and O. Lev, Anal. Chem. 1989, 61, 132; (b). A. J. Bard, F.-R. F. Fan, and M. V. Mirkin in Electroanalytical Chemistry, Vol.18 (A. J. Bard, ed.), Marcel Dekker, New York, 1994, p. 243.
- e.g., (a). For a review of early potentiometric SECM experiments, see Ref. 1b; (b). C. Wei, A. J. Bard, G. Nagy, and K. Toth, Anal. Chem. 1995, 67, 1346; (c). K. Toth, G. Nagy, C. Wei, and A. J. Bard, Electroanal. 1995, 7, 801; (d). M. Kupper and J. W. Schultze, Fres. J. Anal. Chem. 1996, 356, 187.
- See also (a). R. C. Engstrom, M. Weber, D. J. Wunder, R. Burgess, and S. Winquist, Anal. Chem. 1986, 58, 844; (b). R. C. Engstrom, T. Meaney, R. Tople, and R. M. Wightman, Anal. Chem. 1987, 59, 2005.
- e.g., (a). D. O. Wipf and A. J. Bard, J. Electrochem. Soc. 1991, 138, 469; (b). B. R. Horrocks, M. V. Mirkin, and A. J. Bard, J. Phys. Chem. 1994, 98, 9106; (c). R. S. Hutton and D. E. Williams, Electrochim. Acta, 1994, 39, 701; (d). N. Casillas, P. James, and W. H. Smyrl, J. Electrochem. Soc. 1995, 142, L16; (e). M. V. Mirkin, T. C. Richards, and A. J. Bard, J. Phys. Chem. 1993, 97, 7672; (f). M. V. Mirkin, L.O.S. Bulhoes, and A. J. Bard, J. Am. Chem. Soc. 1993, 115, 201; (g). J. V. Macpherson, M. A. Beeston, and P. R. Unwin, J. Chem. Soc. Faraday Trans. 1995, 91, 899.
- e.g., (a). F. M. Zhou, P. R. Unwin, and A. J. Bard, J. Phys. Chem. 1992, 96, 4917; (b). P.R. Unwin and A. J. Bard, J. Phys. Chem. 1991, 95,7814; (c). F. M. Zhou and A. J. Bard, J. Am Chem. Soc. 1994, 116, 393; (d). D. A. Treichel, M. V. Mirkin, and A. J. Bard, J. Phys. Chem. 1994, 98, 5751; (e). C. 100, 17881; (f). C. J. Slevin, J. A. Umbers, J. H. Atherton, and P. R. Unwin, J. Chem. Soc. Faraday Demaille, P. R. Unwin, and A. J. Bard, J. Phys. Chem. 1996, 100, 14137.
- e.g., (a). C. Lee and A. J. Bard, Anal. Chem. 1990, 62, 1906; (b). C. Lee, J. Kwak, and F. C. Anson, Anal. Chem. 1991, 63, 1501; (c). J. Kwak, C. Lee, and A. J. Bard, J. Electrochem. Soc. 1990, 137, 1481; (d). C. Lee and F. C. Anson, Anal. Chem. 1992, 64, 250. (e). I. C. Jeon and F. C. Anson, Anal. Chem. 1992, 64, 2021; (f). M. V. Mirkin, F.-R. F. Fan, and A. J. Bard, Science, 1992, 257, 364. (g). M. Arca, M. V. Mirkin, and A. J. Bard, J. Phys. Chem. 1995, 99, 5040; (h). M. Pyo and A. J. Bard, Electrochim. Acta 1997, 42, 3077; (i). E. R. Scott, A. I. Laplaza, H. S. White, and J. B. Phipps, Pharmaceut. Res. 1993, 10, 1699; (j). S. R. Snyder and H. S. White, J. Electroanal. Chem. 1995, 394, 177; (k). S. B. Basame and H. S. White, J. Phys. Chem. 1995, 99,16430; (l). N. Casillas, S. Charlebois, W. H. Smyrl, and H. S. White, J. Electrochem. Soc. 1994, 141, 636; (m). D. O. Wipf, Colloid Surf. A, 1994, 93, 251. (n). E. R. Scott, H. S. White, and J. B. Phipps, Solid State Ionics 1992, 53, 176; (o). S. Nugnes and G. Denuault, J. Electroanal. Chem. 1996, 408, 125; (p). M. H. T. Frank and G. Denuault, J. Electroanal. Chem. 1993, 354, 331; (q). J. V. Macpherson and P. R. Unwin, J. Chem. Soc. Faraday Trans. 1993, 89, 1883; (r). J. V. Macpherson and P. R. Unwin, J. Phys. Chem. 1994, 98, 1704; (s). J. V. Macpherson and P. R. Unwin. J Phys. Chem. 1995, 99, 14824; 1996, 100, 19475; (t). J. V. Macpherson, C. J. Slevin, and P. R. Unwin, J. Chem. Soc. Faraday Trans. 1996, 92, 3799; (u). K. Borgwarth, C. Ricken, D. G. Ebling, and Heinze, Ber. Bunsenges. Phys. Chem. 1995, 99, 1421; (v). Y. Y. Zhu and D. E. Williams, J. Electrochem. Soc. 1997, 144, L43; (w). C. Jehoulet, Y. S. Obeng, Y. T. Kim, F. M. Zhou, and A. J. Bard, J. Am. Chem. Soc. 1992, 114, 4237; (x). E. R. Scott, H. S. White, and J. B. Phipps, J. Membrane Sci.. 1991, 58, 71; (y). H. Sugimura, T. Uchida, N. Kitamura, and H. Masuhara, J. Phys. Chem. 1994, 98, 4352; (z). J. E. Vitt and R. C. Engstrom, Anal. Chem. 1997, 69, 1070.
- e.g., (a). C. Wei, A. J. Bard, and M. V. Mirkin, J. Phys. Chem. 1995, 99, 16033; (b). T. Solomon and A. J. Bard, J. Phys. Chem. 1995, 67, 2787; (c). T. Solomon and A. J. Bard, J. Phys. Chem. 1995, 99, 17487; (d). Y. Selzer and D. Mandler, J. Electroanal. Chem. 1996, 409, 15; (e). M. Tsionsky, A. J. Bard, and M. V. Mirkin, J. Phys. Chem. 1996, Trans. 1996, 92, 5177; (g). Y. H. Shao, M. V. Mirkin, and J. F. Rusling, J. Phys. Chem. B 1997, 101, 3202; (h). M. Tsionsky, A. J. Bard, and M. V. Mirkin, J. Am. Chem. Soc. 1997, 119, 10785; (i). M.-H. Delville, M. Tsionsky, and A. J. Bard, (submitted to J. Am. Chem. Soc. for publication).
- e.g., (a). D. T. Pierce and A. J. Bard, Anal. Chem. 1993, 65, 3598; (b). B. R. Horrocks, D. Schmidtke, A. Heller, and A. J. Bard, Anal. Chem. 1993, 65, 3605; (c). H. Yamada, H. Shiku, T. Matsue, and I. Uchida, Bioelectrochem. Bioenerg. 1994, 33, 91; (d). B. Grundig, G. Wittstock, U. Rudel, and B. Strehlitz, J. Electroanal. Chem. 1995, 395, 143; (e). G. Wittstock, K. J. Yu, H. B. Halsall, T. H. Ridgway, and W. R. Heineman, Anal. Chem. 1995, 67, 3578; (f). H. Shiku, T. Matsue, and I. Uchida, Anal. Chem. 1996, 68, 1276; (g). J. L. Gilbert, S. M. Smith, and E. P. Lautenschlager, J. Biomed. Mater. Res. 1993, 27, 1357; (h). C. Kranz, T. Lotzbeyer, H. L. Schmidt, and W. Schuhmann, Biosens. Bioelectron. 1997, 12, 257; (i). C. Kranz, G. Wittstock, H. Wohlschlager, and W. Schuhmann, Electrochim. Acta, 1997, 42, 3105; (j). C. Lee, J. Kwak, and A. J. Bard, Proc. Natl. Acad. Sci. U.S.A. 1990, 87, 1740; (k). R. B. Jackson, M. Tsionsky, Z. G. Cardon, and A. J. Bard, Plant Physiol. 1996, 112, 354; (l). M. Tsionsky, Z. G. Cardon, A. J. Bard, and R. B. Jackson, Plant Physiol. 1997, 113, 895.
- e.g., (a). C. W. Lin, F.-R. F. Fan, and A. J. Bard, J. Electrochem. Soc. 1987, 134, 1038; (b). D. H. Craston, C. W. Lin, and A. J. Bard, J. Electrochem. Soc. 1988, 135, 785; (c). D. Mandler and A. J. Bard, J. Electrochem. Soc. 1989, 136, 3143; (d). D. Mandler and A. J. Bard, J. Electrochem. Soc. 1990, 137, 2468; (e). O. E. Husser, D. H. Craston, and A. J. Bard. J. Vac. Sci. Technol. B 1988, 6, 1873; (f). Y.-M. Wuu, F.-R. F. Fan, and A. J. Bard, J. Electrochem. Soc. 1989, 136, 885; (g). H. Sugimura, T. Uchida, N. Shimo, N. Kitamura, and H. Masuhara, Ultramicroscopy 1992, 42, 468; (h). I. Shohat and D. Mandler, J. Electrochem. Soc. 1994, 141, 995; (i). S. Meltzer and D. Mandler, J. Chem. Soc. Faraday Trans. 1995, 91, 1019; (j). C. Kranz, H. E. Gaub, and W. Schuhmann, Advan. Mater. 1996, 8, 634; (k). J. F. Zhou and D. O. Wipf, J. Electrochem. Soc. 1997, 144, 1202.