The TREQCM - CHI400A Series <<<Home
Time Resolved Electrochemical Quartz Crystal Microbalance
The quartz crystal microbalance (QCM) is a variant of acoustic wave microsensors that are capable of ultrasensitive mass measurements. Under favorable conditions, a typical QCM can measure a mass change of 0.1-1 ng/cm2. QCM oscillates in a mechanically resonant shear mode under the influence of a high frequency AC electric field which is applied across the thickness of the crystal. Figure 1b shows an edge view of a QCM crystal that is undergoing the shear distortion from the oscillation. The central portions of the top and bottom sides of the crystal are coated with a typically disk-shaped thin film of gold or other metals. The mass sensitivity of the QCM originates from the relationship between the oscillation frequency on the total mass of the crystal and the adlayers of materials residing at the metal-coated crystals, given by the Sauerbrey equation below:
Df = -2f02 Dm / [A sqrt(mr)]
where f0 is the resonant frequency of the fundamental mode of the crystal, A is the area of the gold disk coated onto the crystal, r is the density of the crystal (= 2.684 g/cm3), and m is the shear modulus of quartz (= 2.947 x 10¹¹ g/cm.s2). Using a crystal with a 7.995-MHz fundamental frequency (as used in our measurements) as an example, a net change of 1 Hz corresponds to 1.34 ng of materials adsorbed or desorbed onto the crystal surface of an area of 0.196 cm2.
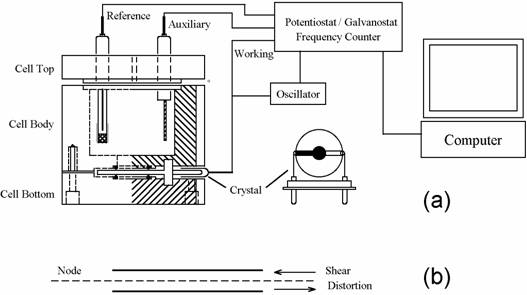
QCM and the combination of QCM with electrochemistry (EQCM) have been widely employed for the determination of metals deposited onto the crystal, studies of ion-transport processes in polymer films, biosensor development, and investigations of the kinetics of adsorption/desorption of adsorbate molecules. In EQCM experiments, the measurements of the various electrochemical parameters, such as potential, current and charge at the working electrode, and the acquisition of the corresponding frequency change, can be conducted simultaneously with the experimental setup shown in Figure 1a. For any model in the CHI400A series, the application of a specific potential waveform (e.g., triangular potential waveform for cyclic voltammetric experiments), as well as subsequent current measurements and the frequency counting, was carried out with a potentiostat/frequency counter, in turn controlled by a computer.
Figure 1. Schematic representation of a typical EQCM instrument. (a) The quartz crystal has a fundamental frequency of 7.995 MHz and is coated with thin gold films on both sides. The gold disk deposited on the top side of the crystal is in contact with the electrolyte solution and used as the working electrode. The top view of the gold-coated crystal is also shown. (b) Edge view of QCM crystal showing shear deformation. The disk thickness and shear deformation have been exaggerated for clarity.
The CHI400A series contains a quartz crystal oscillator, frequency counter, fast digital function generator, high-resolution and high-speed data acquisition circuitry, potentiostat, and a galvanostat (Model 440A only). The QCM is integrated with potentiostat and galvanostat, making the EQCM study simple and convenient. Instead of measuring the frequency directly, the CHI400A series uses time-resolved mode. The frequency signal of the QCM is subtracted from a standard reference frequency. The difference is then measured by a reciprocal technique, which greatly reduces the time needed to sample the QCM signal and gives much better time resolution of the QCM signal. With the direct counting method, a 1 Hz QCM resolution requires 1 second of sampling time, and a 0.1 Hz resolution requires 10 seconds of sampling time. The time-resolved mode allows the QCM signal to be measured in milliseconds with much better resolution.
The potential control range of the instrument is ±10 V and the current range is ±250 mA. Besides QCM and EQCM measurements, the instrument can also be used for general-purpose electrochemical applications, which are integrated. The instrument is very sensitive and very fast, capable of measuring current down to the picoampere level. The scan rate in cyclic voltammetry can be up to 100 V/s with a 0.1 mV potential increment or 2000 V/s with a 2 mV potential increment.
Figure 2 shows the voltammogram of underpotential and bulk depositions of Pb from a 0.1 M HClO4 solution containing 1 mM Pb2+, and the corresponding frequency changes have been plotted as a function of the applied potential. In Figure 2a, the cathodic peaks at –0.28 V and at ca. –0.59 V have been assigned to the underpotential deposition of monolayer Pb and the bulk deposition of multlayers of Pb, respectively, whereas the anodic peaks at –0.41 V and at –0.28 V are attributable to the stripping of the deposited Pb. The frequency-potential diagram (Figure 2b) displays the frequency decrease due to the deposition of monolayer Pb (about 25 Hz or 33.5 ng between –0.28 V and –0.59 V) and the more drastic frequency decrease arising from bulk Pb deposition (a net change of 425 Hz or 573.8 ng at ca. –0.5 V).
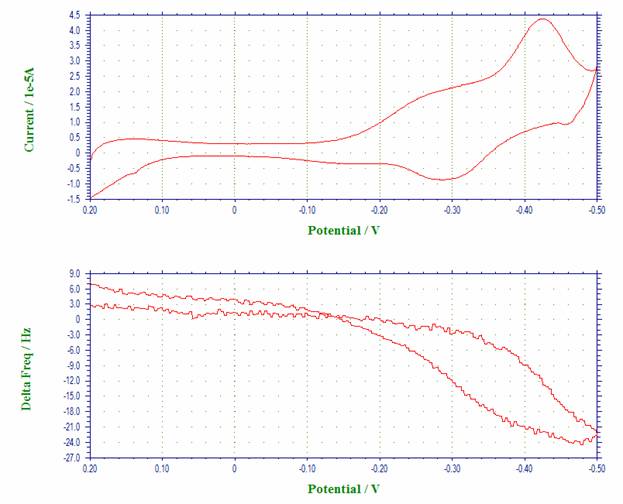
Figure 2. Voltammogram and QCM data of Pb underpotential deposition. Scan rate = 0.05 V/s.
Figure 3 depicts the voltammogram of the oxidation of pyrrole to form polypyrrole film at the gold-coated crystal and the corresponding frequency change. Five scan segments between the lower limit of –1.0 V and the upper limit of 1.0 V were conducted in this experiment. As clearly shown in Figure 3a, pyrrole monomer can be oxidized to its radical at ca. 0.65 V. When this occurred, a thin polypyrrole film was formed, resulting in a decrease of the fundamental frequency of the quartz crystal (Figure 3b). During the first potential cycle, the net frequency change was found to be 1150 Hz. The frequency ceased to change, as the potential became insufficiently positive for the synthesis of polypyrrole film. The subsequent potential cycles displayed in Figure 3 demonstrate the continuous growth of polypyrrole film and the further frequency decrease or mass increase at the crystal. A fast scan rate (0.1 V/s) was employed.
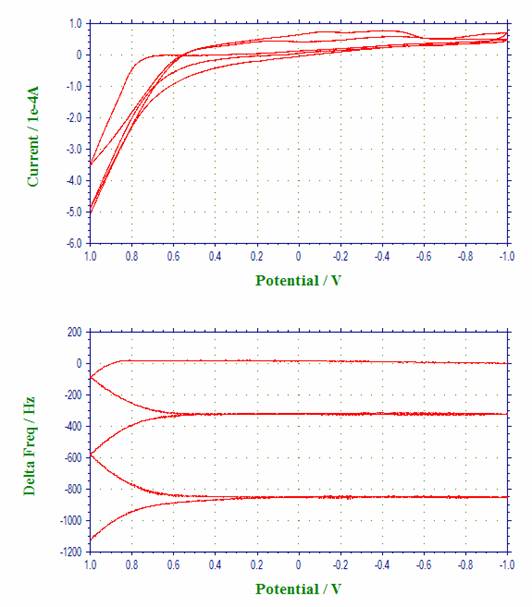
Figure 3. Voltammogram and QCM data of oxidation of pyrrole to form polypyrrole film. Scan rate 0.1 V/s.
The instrument can also be used for regular QCM. Figure 4 shows the QCM data of flow cell detection. The total frequency change is less than 8 Hz. The long term drift and noise levels are extremely low.
The model 400A series is our upgrade to the model 400 series. The redesigned instrument contains a new processor (about 50 times faster than the 400) and FLASH memory (allowing instrument updates to be distributed by e-mail instead of the shipment of an EPROM chip).
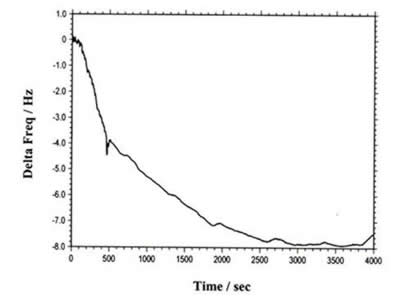
Figure 4. A typical flow injection-QCM experiment. As soon as the sample is injected, the QCM starts recording the frequency change (t = 0). The pump is stopped at 460 s (where a small glitch on the curve can be seen). The reaction is completed about 40 min after sample injection. The total monitoring time is over 1 hr. A net change of 8 Hz is monitored. After 40 min or so, the frequency becomes very stable again (for at least more than 20 min, the frequency drift is much less than 1 Hz).
The 400A series has a serial port (default) and a USB for data communication with the PC. You can select either serial port or USB (but not both) by changing the jumper setting on the board.
A 16-bit highly stable bias circuitry is added for current or potential bias. This allows wider dynamic range is ac measurements. It can also be used to re-zero the dc current output.
The EQCM cell consists of three round Teflon pieces (Figure 1a). The total height is 37 mm with a diameter of 35 mm. The top piece is the cell top to hold reference and counter electrodes. There are also two 2 mm holes for manual purging. The centre piece is the solution cell, and the bottom piece is for mounting purposes. Four screws are used to tighten the O-ring seal between the bottom centre piece. The quartz crystal is located between the centre and bottom pieces. The diameter of the quartz crystal is 13.7 mm. The gold electrode diameter is 5.1 mm.
Specifications
|
Potentiostat Galvanostat (Model 440A) Potential range: -10 to 10V Potentiostat rise time: < 2 us Compliance voltage: ±12 V 3- or 4-electrode configuration Current range: 250 mA Reference electrode input impedance: 1´1012 ohm Sensitivity scale: 1´10-12 - 0.1 A/V in 34 ranges Input bias current: < 50 pA Current measurement resolution: < 0.01 pA Minimum potential increment in CV: 100 mV Data acquisition: 16 bit @ 200 kHz Frequency resolution: < 0.1 Hz QCM maximum sampling rate: 1 kHz Automatic and manual iR compensation |
|
CV and LSV scan rate: 0.000001 to 2000 V/s Potential increment during scan: 0.1 mV @ 100 V/s CA and CC pulse width: 0.0001 to 1000 sec CA and CC Steps: 320 DPV and NPV pulse width: 0.0001 to 10 sec SWV frequency: 1 to 100 kHz ACV frequency: 1 to 10 kHz SHACV frequency: 1 to 5 kHz Automatic potential and current zeroing Low-pass signal filters, automatic and manual setting RDE rotation control output: 0 - 10 V (430 and up) Cell control: purge, stir, knock Data length: 128K – 4096K selectable Dimension: 12.5”(W) ´ 11”(D) ´ 4.75”(H) Oscillator Box (external): 4.75"(L) ´ 2.6" (W) ´ 1.55" (H) Weight: 15 Lb. |
Differences Between 400A Series Models
|
Functions |
400A |
410A |
420A |
430A |
440A |
|
Cyclic Voltammetry (CV) |
l |
l |
l |
l |
l |
|
Linear Sweep Voltammetry (LSV) & |
l |
l |
l |
l |
l |
|
Staircase Voltammetry (SCV) #,& |
|
|
|
l |
l |
|
Tafel Plot (TAFEL) |
|
|
|
l |
l |
|
Chronoamperometry (CA) |
l |
|
l |
l |
l |
|
Chronocoulometry (CC) |
l |
|
l |
l |
l |
|
Differential Pulse Voltammetry (DPV) #,& |
|
l |
l |
l |
l |
|
Normal Pulse Voltammetry (NPV) #,& |
|
l |
l |
l |
l |
|
Differential Normal Pulse Voltammetry (DPNV)#,& |
|
|
|
|
l |
|
Square Wave Voltammetry (SWV) & |
|
|
l |
l |
l |
|
AC Voltammetry (ACV) #,&,$ |
|
|
|
l |
l |
|
2nd Harmonic AC Voltammetry (SHACV) #,&,$ |
|
|
|
l |
l |
|
Amperometric I-t Curve (I-t) |
|
|
|
l |
l |
|
Differential Pulse Amperometry (DPA) |
|
|
|
|
l |
|
Double Differential Pulse Amperometry (DDPA) |
|
|
|
|
l |
|
Triple Pulse Amperometry (TPA) |
|
|
|
|
l |
|
Bulk Electrolysis with Coulometry (BE) |
l |
|
l |
l |
l |
|
Hydrodynamic Modulation Voltammetry (HMV) |
|
|
|
|
l |
|
Sweep-Step Functions (SSF) |
|
|
|
|
l |
|
Multi-Potential Steps (STEP) |
|
|
|
|
l |
|
Chronopotentiometry (CP) |
|
|
|
|
l |
|
Chronopotentiometry with Current Ramp (CPCR) |
|
|
|
|
l |
|
Potentiometric Stripping Analysis (PSA) |
|
|
|
|
l |
|
Open Circuit Potential - Time (OCPT) |
l |
l |
l |
l |
l |
|
Quartz Crystal Microbalance (QCM) |
l |
l |
l |
l |
l |
|
|
|
|
|
|
|
|
Galvanostat |
|
|
|
|
l |
|
RDE control (0-10V output) |
|
|
|
l |
l |
|
Full version of CV simulator |
|
|
|
l |
l |
|
Limited version of CV simulator |
l |
l |
l |
|
|
|
iR Compensation |
l |
l |
l |
l |
l |
#: Corresponding polarographic mode can be performed.
&: Corresponding stripping mode can be performed.
$: Phase selective data are available.